Product Design
A guided five-step sign-up and a dashboard to run the community
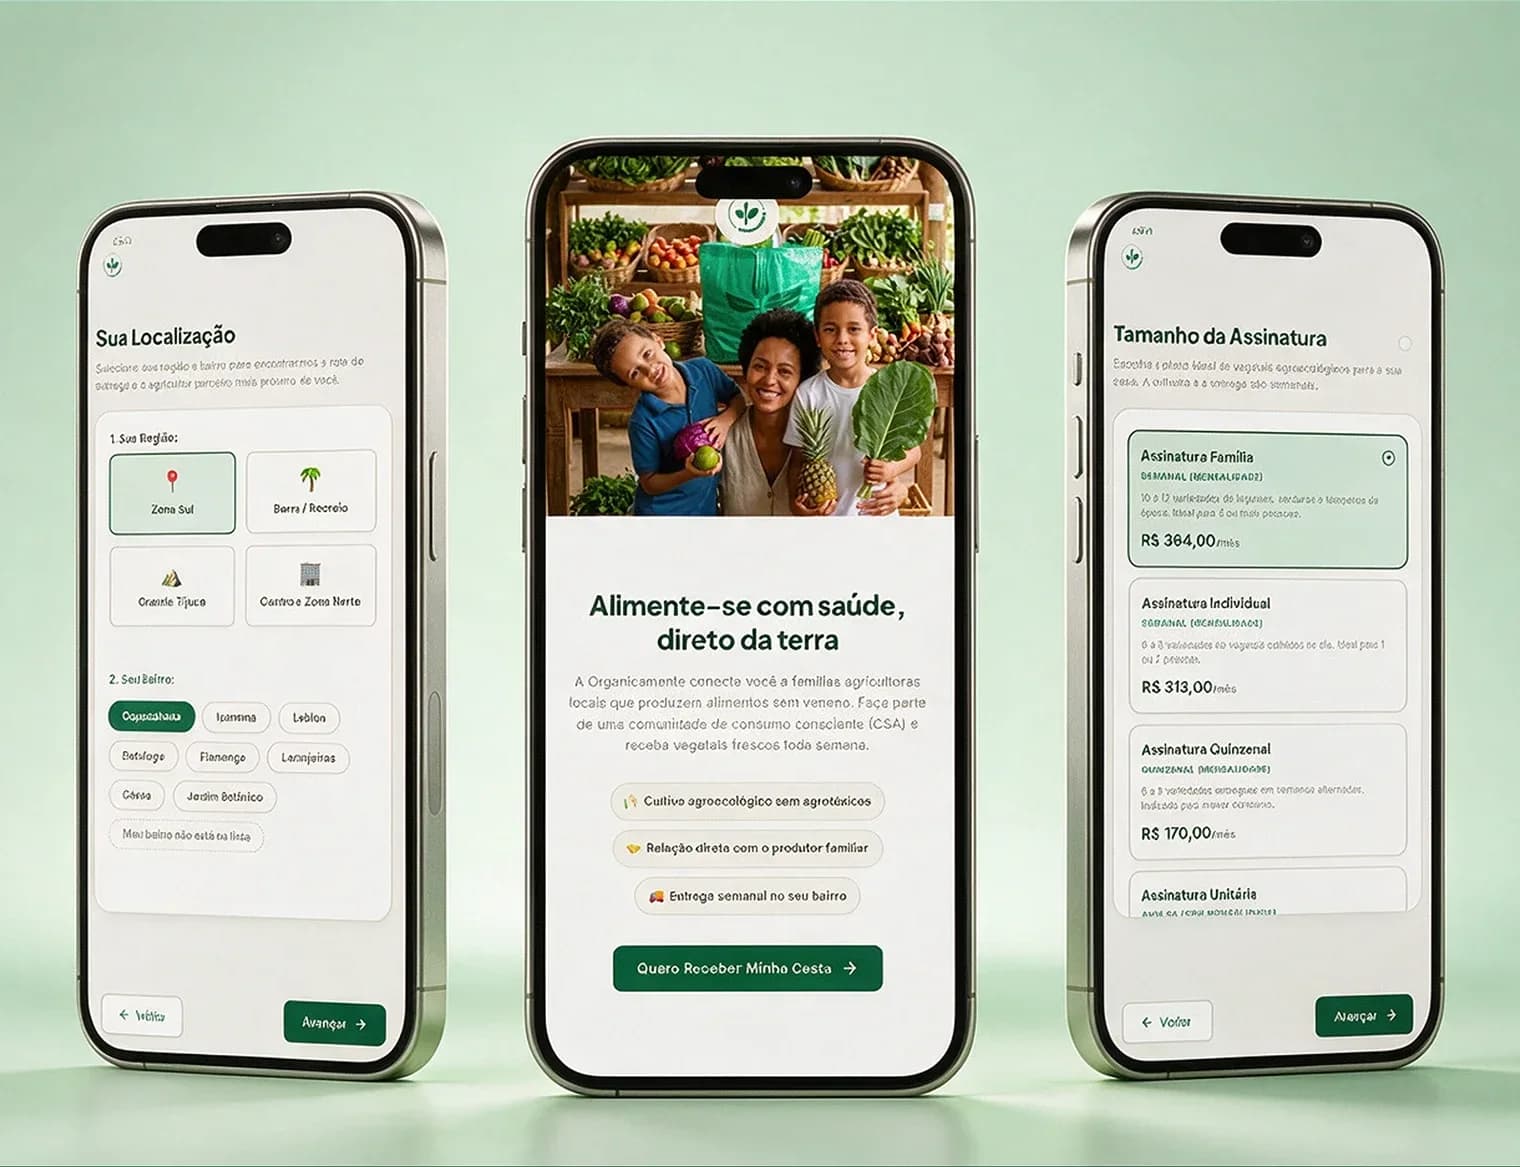
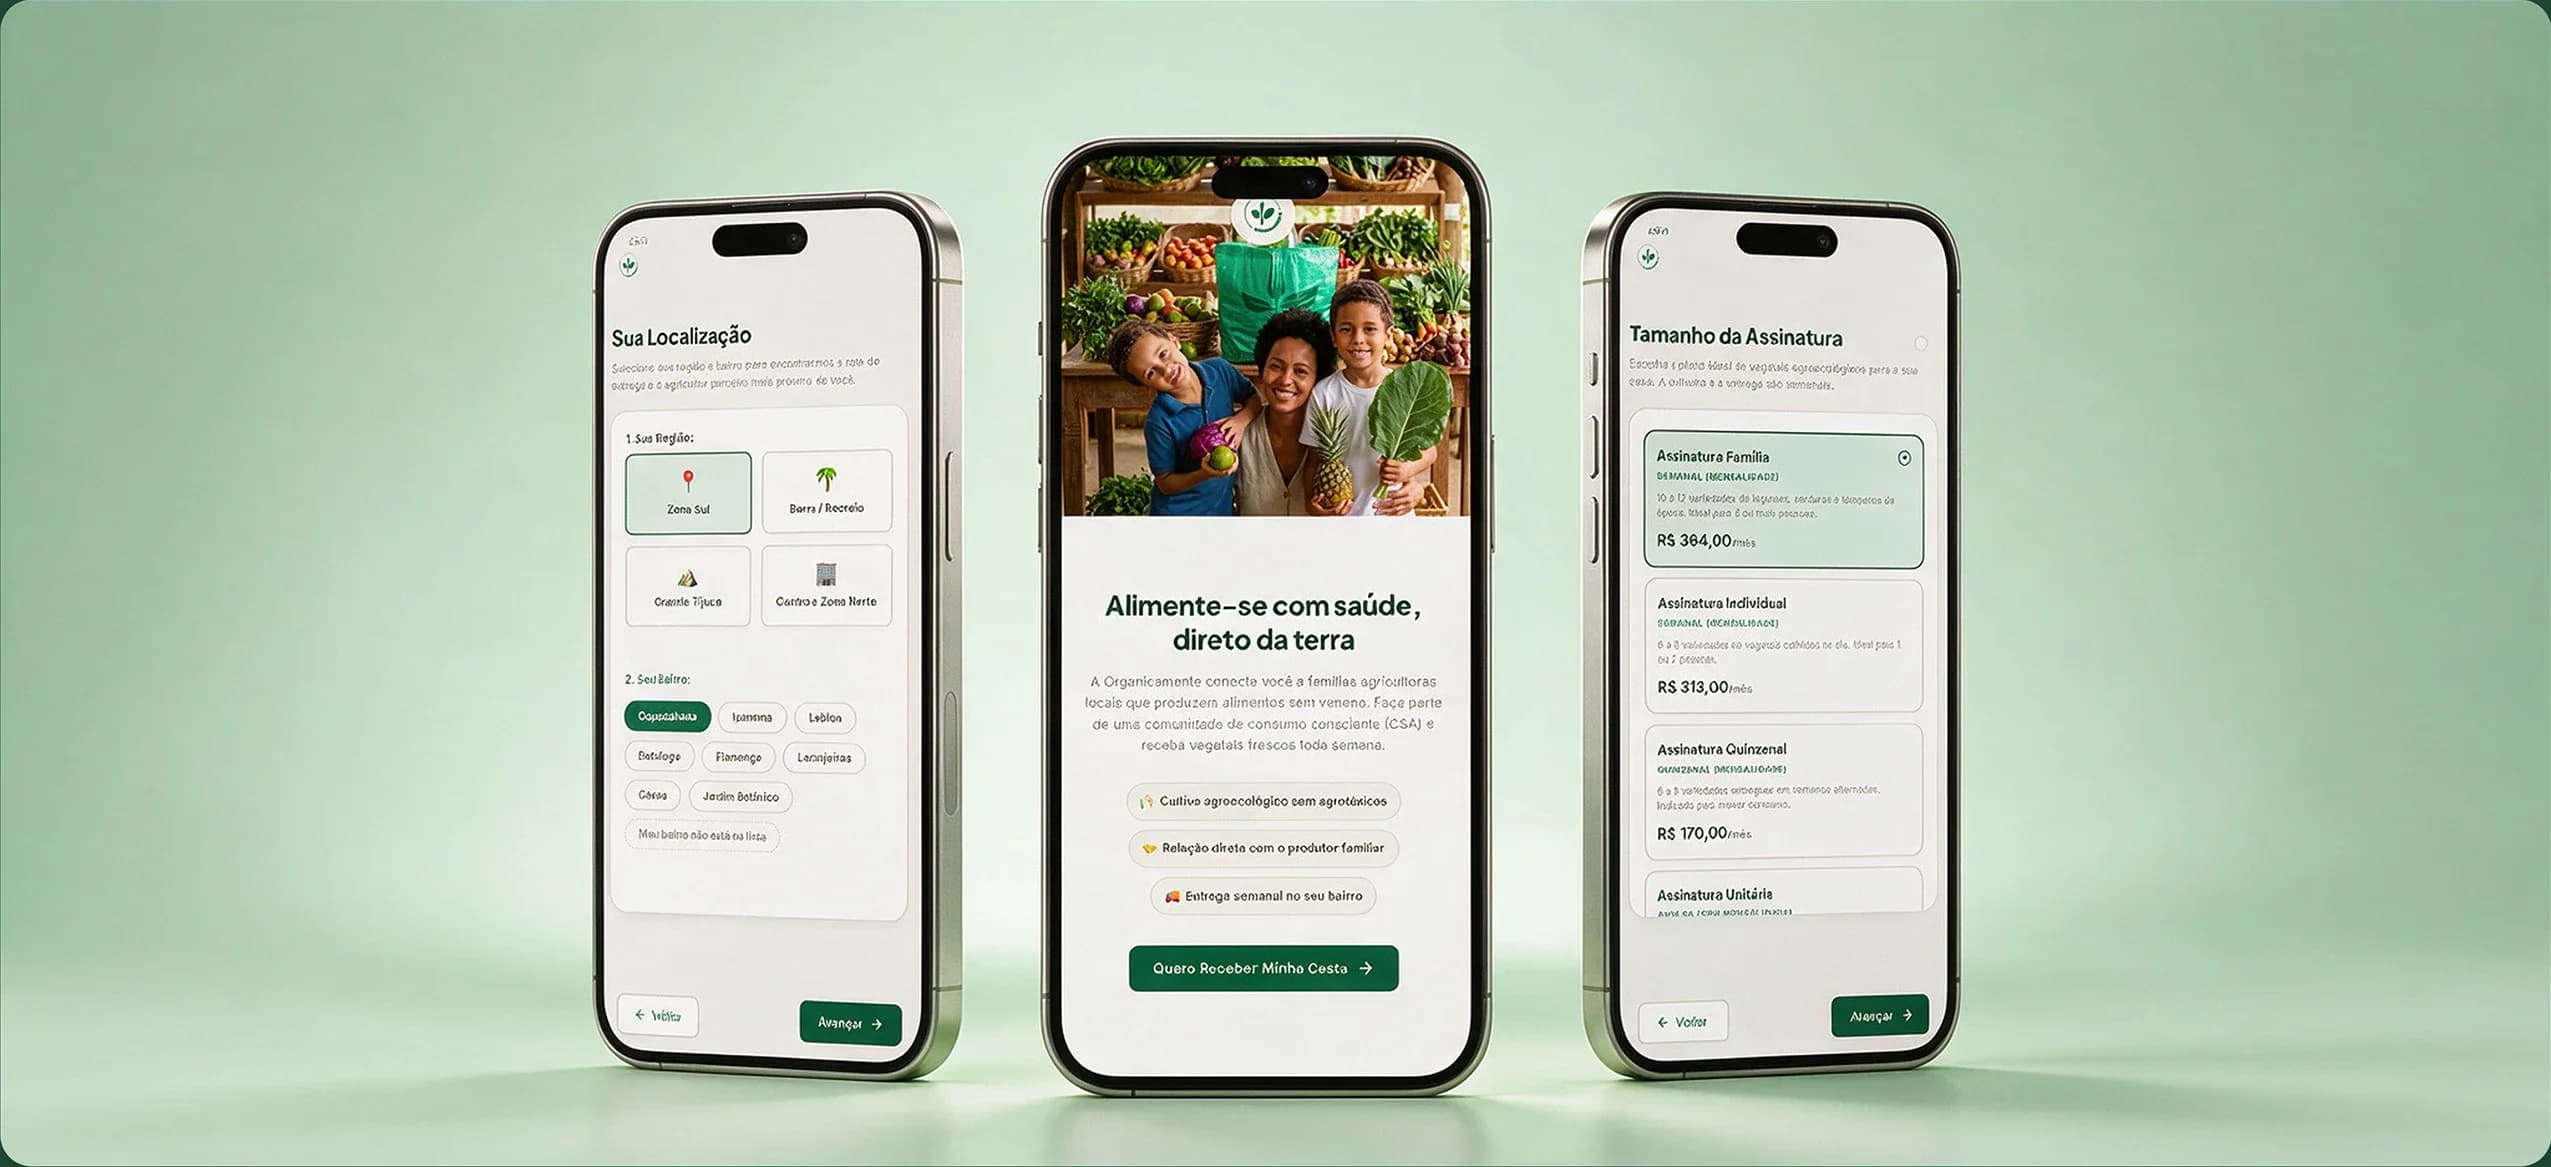
A redesign of the front door and back office of a CSA in Rio. The three-page form became a flow that validates the region right at the start, and the spreadsheets became a dashboard for the team.
- Client
- Organicamente
- Role
- Product Designer
- Tools
- Figma, Claude Code
- Year
- 2026
Built with·Supabase, Vercel, Google Apps Script
(01)
About
Organicamente is a CSA (Community Supported Agriculture) in Rio de Janeiro. Subscribers fund the planting of agroecological family farmers and receive fixed baskets every week or every two weeks.
I work on the project as a growth and product partner, and this case tells how I redesigned the front door and the back office of the operation.
- Product Design
- UI/UX Design
(02)
Project summary
- Problem
- Leads who were served did not get to subscribe, and the team ran everything on spreadsheets
- My role
- Product Designer, from discovery to code, working alone
- Constraint
- A small, non-technical team, a tight budget, billing integrated with Asaas and almost ten years of data to migrate
- Outcome
- In the first month, 6 new subscribers and closing in 12h to 24h. Data collection is ongoing
- Stack
- Figma, Claude Code, Supabase, Vercel and Google Apps Script
(03)
Context
Someone who joins a CSA is not buying a one-off product. They enter a recurring monthly pact, tied to a specific farmer and a delivery route by region. Sign-up is a delicate moment, because the person needs to understand the model, choose a plan and region, and trust before paying.
- Step 1
- Understand the model
- Step 2
- Choose plan and region
- Step 3
- Trust before paying
(04)
The problem
For those who wanted to subscribe
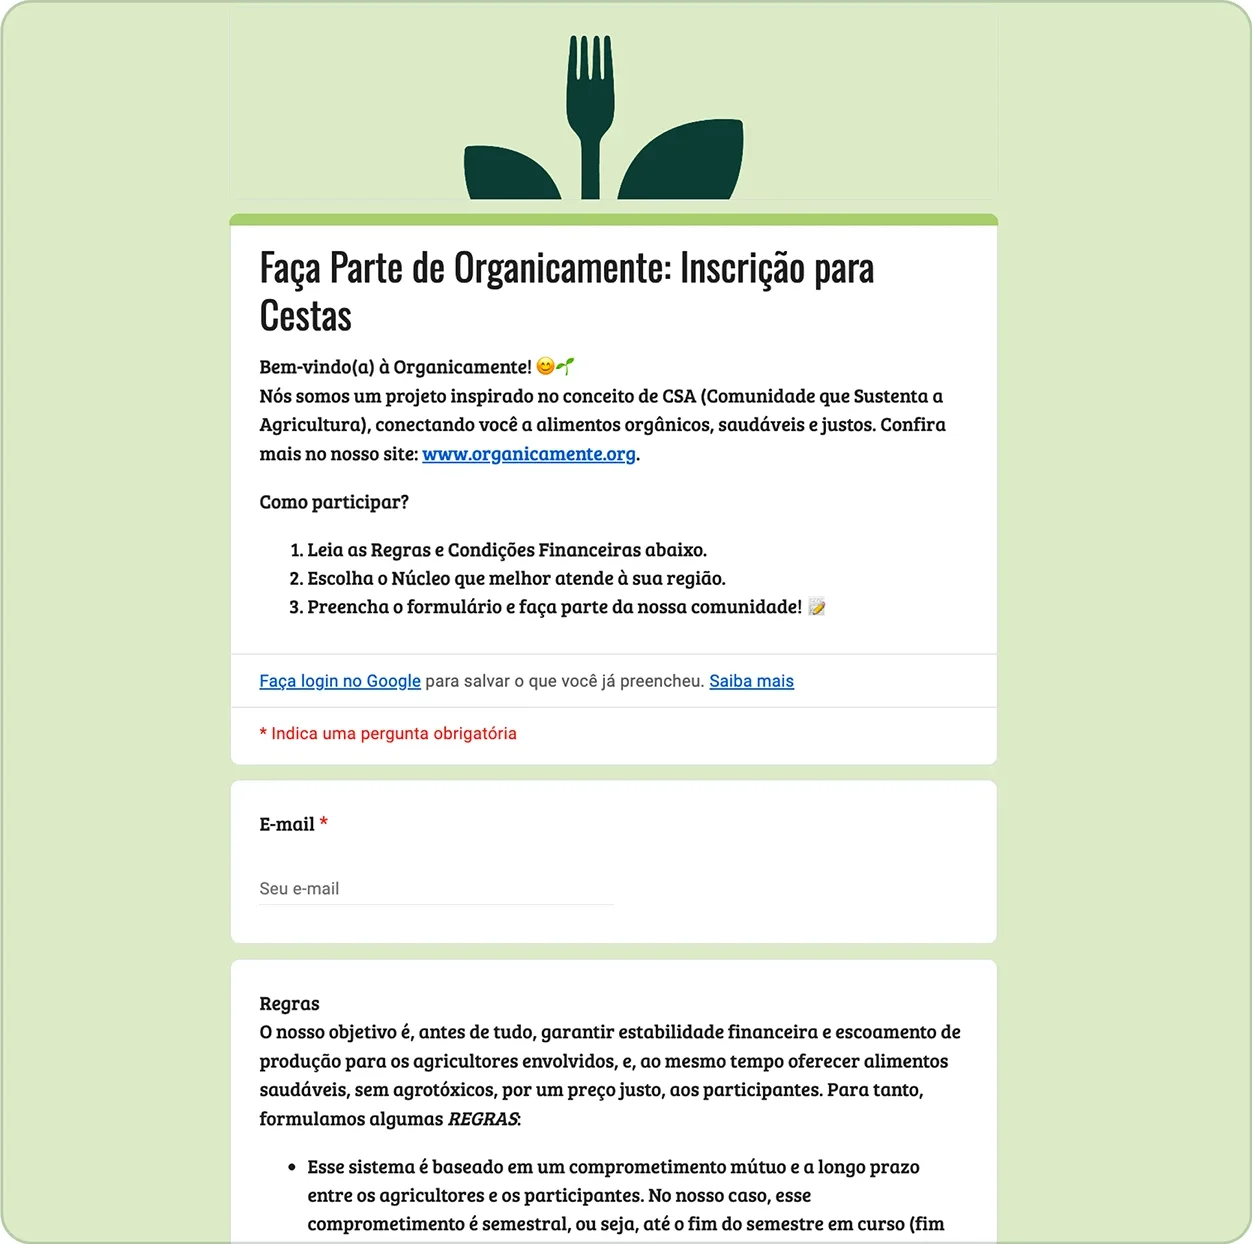
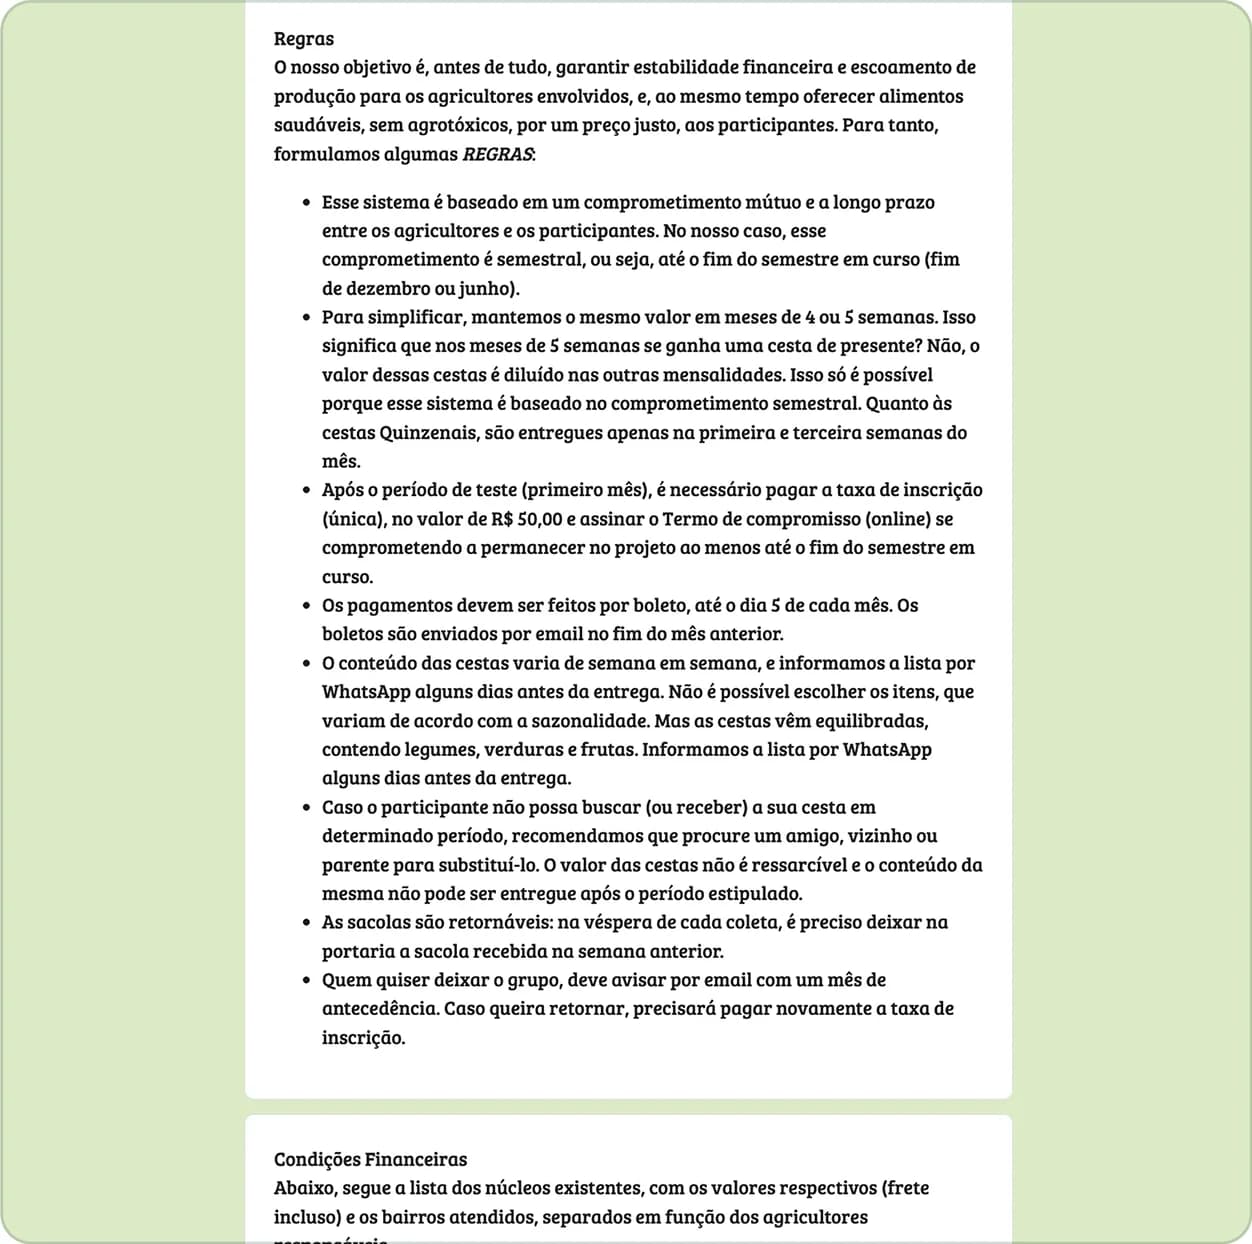
The path started in a Google Form about ten years old. Before any choice, the person faced eight rules in a block of text, two price tables with dozens of values, and only then chose a region. In total it was three pages and 16 fields, with the email asked twice. Many people ignored the text and contacted support on WhatsApp to ask what was already written.
For those who operated it
Every sign-up was checked by hand. Finance calculated each subscriber's amount manually, and the data lived in spreadsheets that were hard to cross-reference, with no automation.
- Pages
- 3
- Fields
- 16
- Rules
- 8
- Price tables
- 2
to finish signing up
with the email asked twice
in a block of text, before anything else
with dozens of values
(05)
Users
There were two audiences with different needs.
Who wants to subscribe
Needs to understand what they are signing up for, feel that the order is simple, and trust the person who will grow their food.
- Understanding
- Simplicity
- Trust
The team
With one person in management, one in support and two in finance, they need to know who joined, how much to charge, where to deliver and who is overdue, without rebuilding that every week.
- Who joined
- How much to charge
- Where to deliver
- Who is overdue
(06)
How I spotted the problem
Leads were arriving, support was answering, and still few closed. In the two reference months I have, there were 5 subscriptions for 108 leads, about 4.6%. The sample is small, but it works as a baseline.
In May I presented the team with an interactive sign-up page, designed to filter out-of-route neighborhoods on the very first click and capture the contact before the lead gave up. When they saw the new flow, the team also pointed out the pains of management. I understood how they organized customers in spreadsheets and decided to build the dashboard.
My hypothesis was that the form acted as a strong blocker in the decision.
It was not the only possible cause, since price, expectations about pesticide-free food and out-of-route leads also weighed. But it was the cause I could test and redesign.
Baseline
≈ 4.6%
lead-to-subscriber conversion
- Leads
- 108
- Subscriptions
- 5
- Reference month 1
- 46 leads · 2 subscriptions
- Reference month 2
- 62 leads · 3 subscriptions
Small sample, used as a reference to measure the new flow.
(07)
Design decisions
I followed the logic “the user needs X, so I did Y”.
Whoever arrives needs to feel at home before committing.
So
I inverted the funnel. The first screen asks for the region and already shows the photo, the story and the delivery day of the responsible farmer. The rules are left for the last step, in visual cards.
The team needs to know early whether they can serve the person.
So
The neighborhood is validated in the first step. Someone who lives outside the route picks “My neighborhood is not on the list”, the next button is locked and the person is taken to WhatsApp to join a waiting list. Nobody spends time filling in a sign-up that could not be served.
The team needs to win back those who give up.
So
Contact comes before address. Whoever drops off midway has already left a name and WhatsApp, and support can pick the conversation back up.
The most common question was whether the price was per delivery or per month.
So
I swapped “basket” for “subscription” on every screen. I also created a side summary that adds up subscription, add-ons and sign-up fee and shows the first month's total.
Whoever joins mid-month should not depend on a manual calculation.
So
The system calculates the prorated amount from the remaining deliveries.
Logistics needs to serve the route.
So
I removed the choice of time slots and the option to call on arrival. The decision came from management, based on delivery operational constraints.
(08)
What I discarded
Discarded keeping the Form with tweaks
The problem was in the structure, not in the appearance.
Discarded using off-the-shelf tools
For cost and for the limitations in modeling a CSA's logic.
Chose to design in Figma and build with Claude Code, Supabase and Vercel
What let me design, test and adjust with the team without depending on another team.
(09)
The solution
Sign-up has five steps. Region and farmer, subscription and add-ons, contact details, address and absence contingency, and finally the pact with the financial summary.
01
Region and farmer
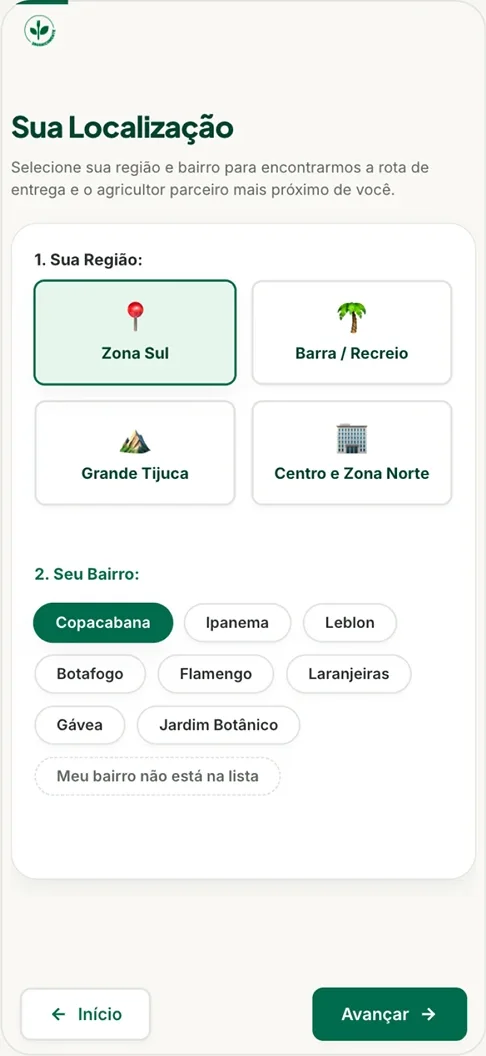
The first screen asks for the region and already shows the responsible farmer
02
Subscription and add-ons
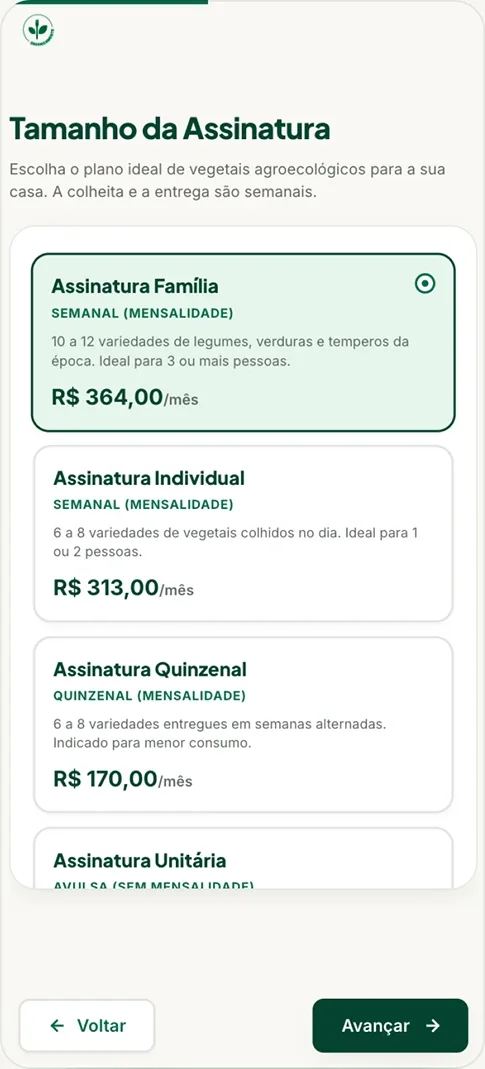
Subscription, add-ons and a side summary with the first month's total
03
Contact details
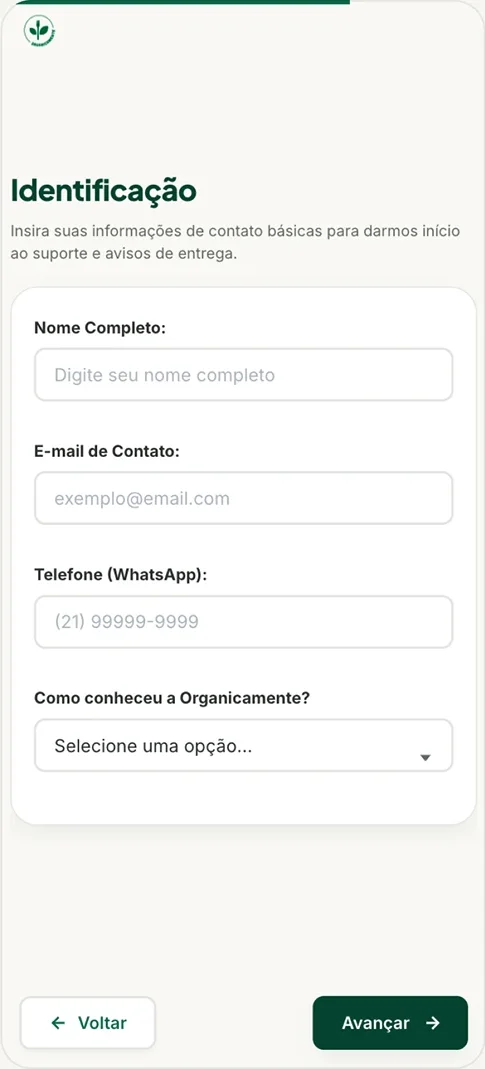
Name and WhatsApp before the address
04
Address and absence
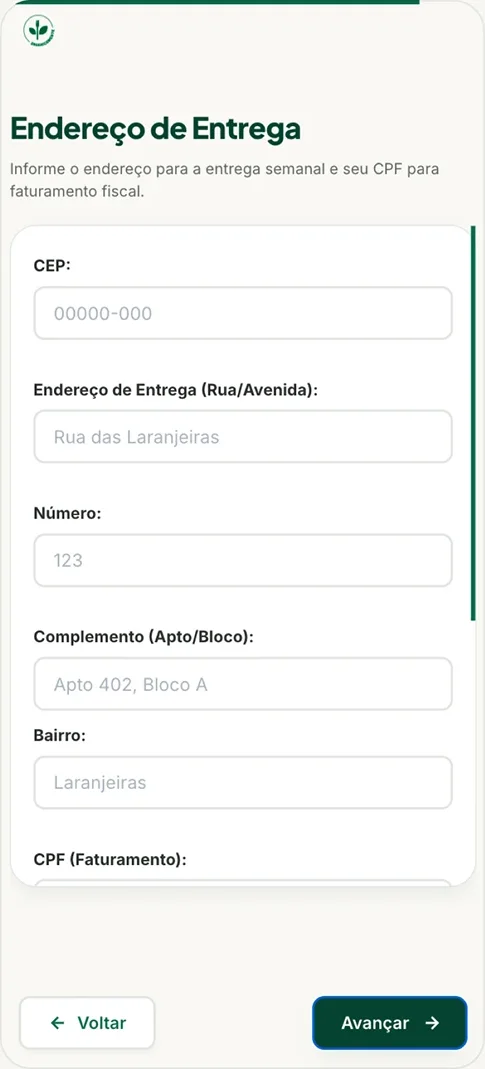
Delivery address and what to do in case of absence
05
Pact and summary
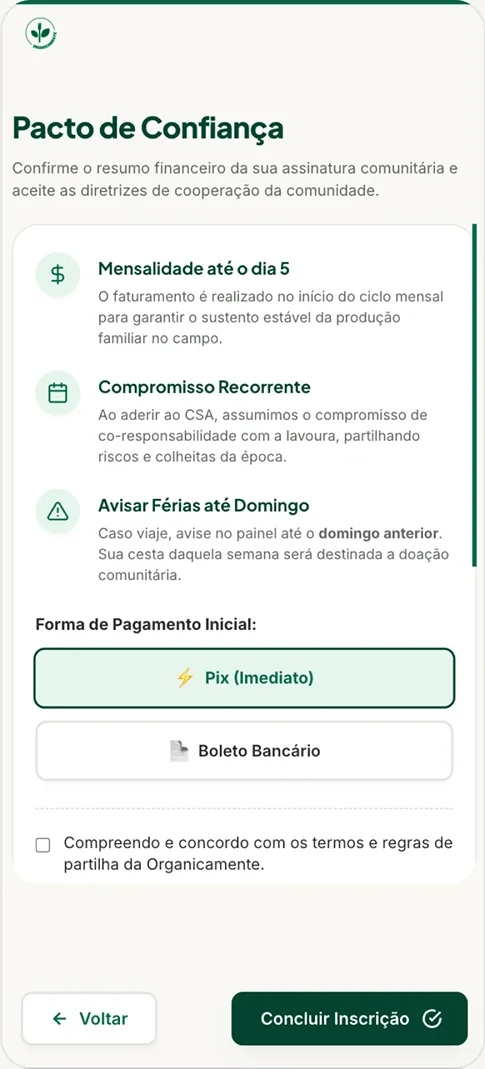
Rules in visual cards and a financial summary
Automatic billing. At the end of sign-up, the charge goes out automatically through Asaas, by PIX or boleto.
(10)
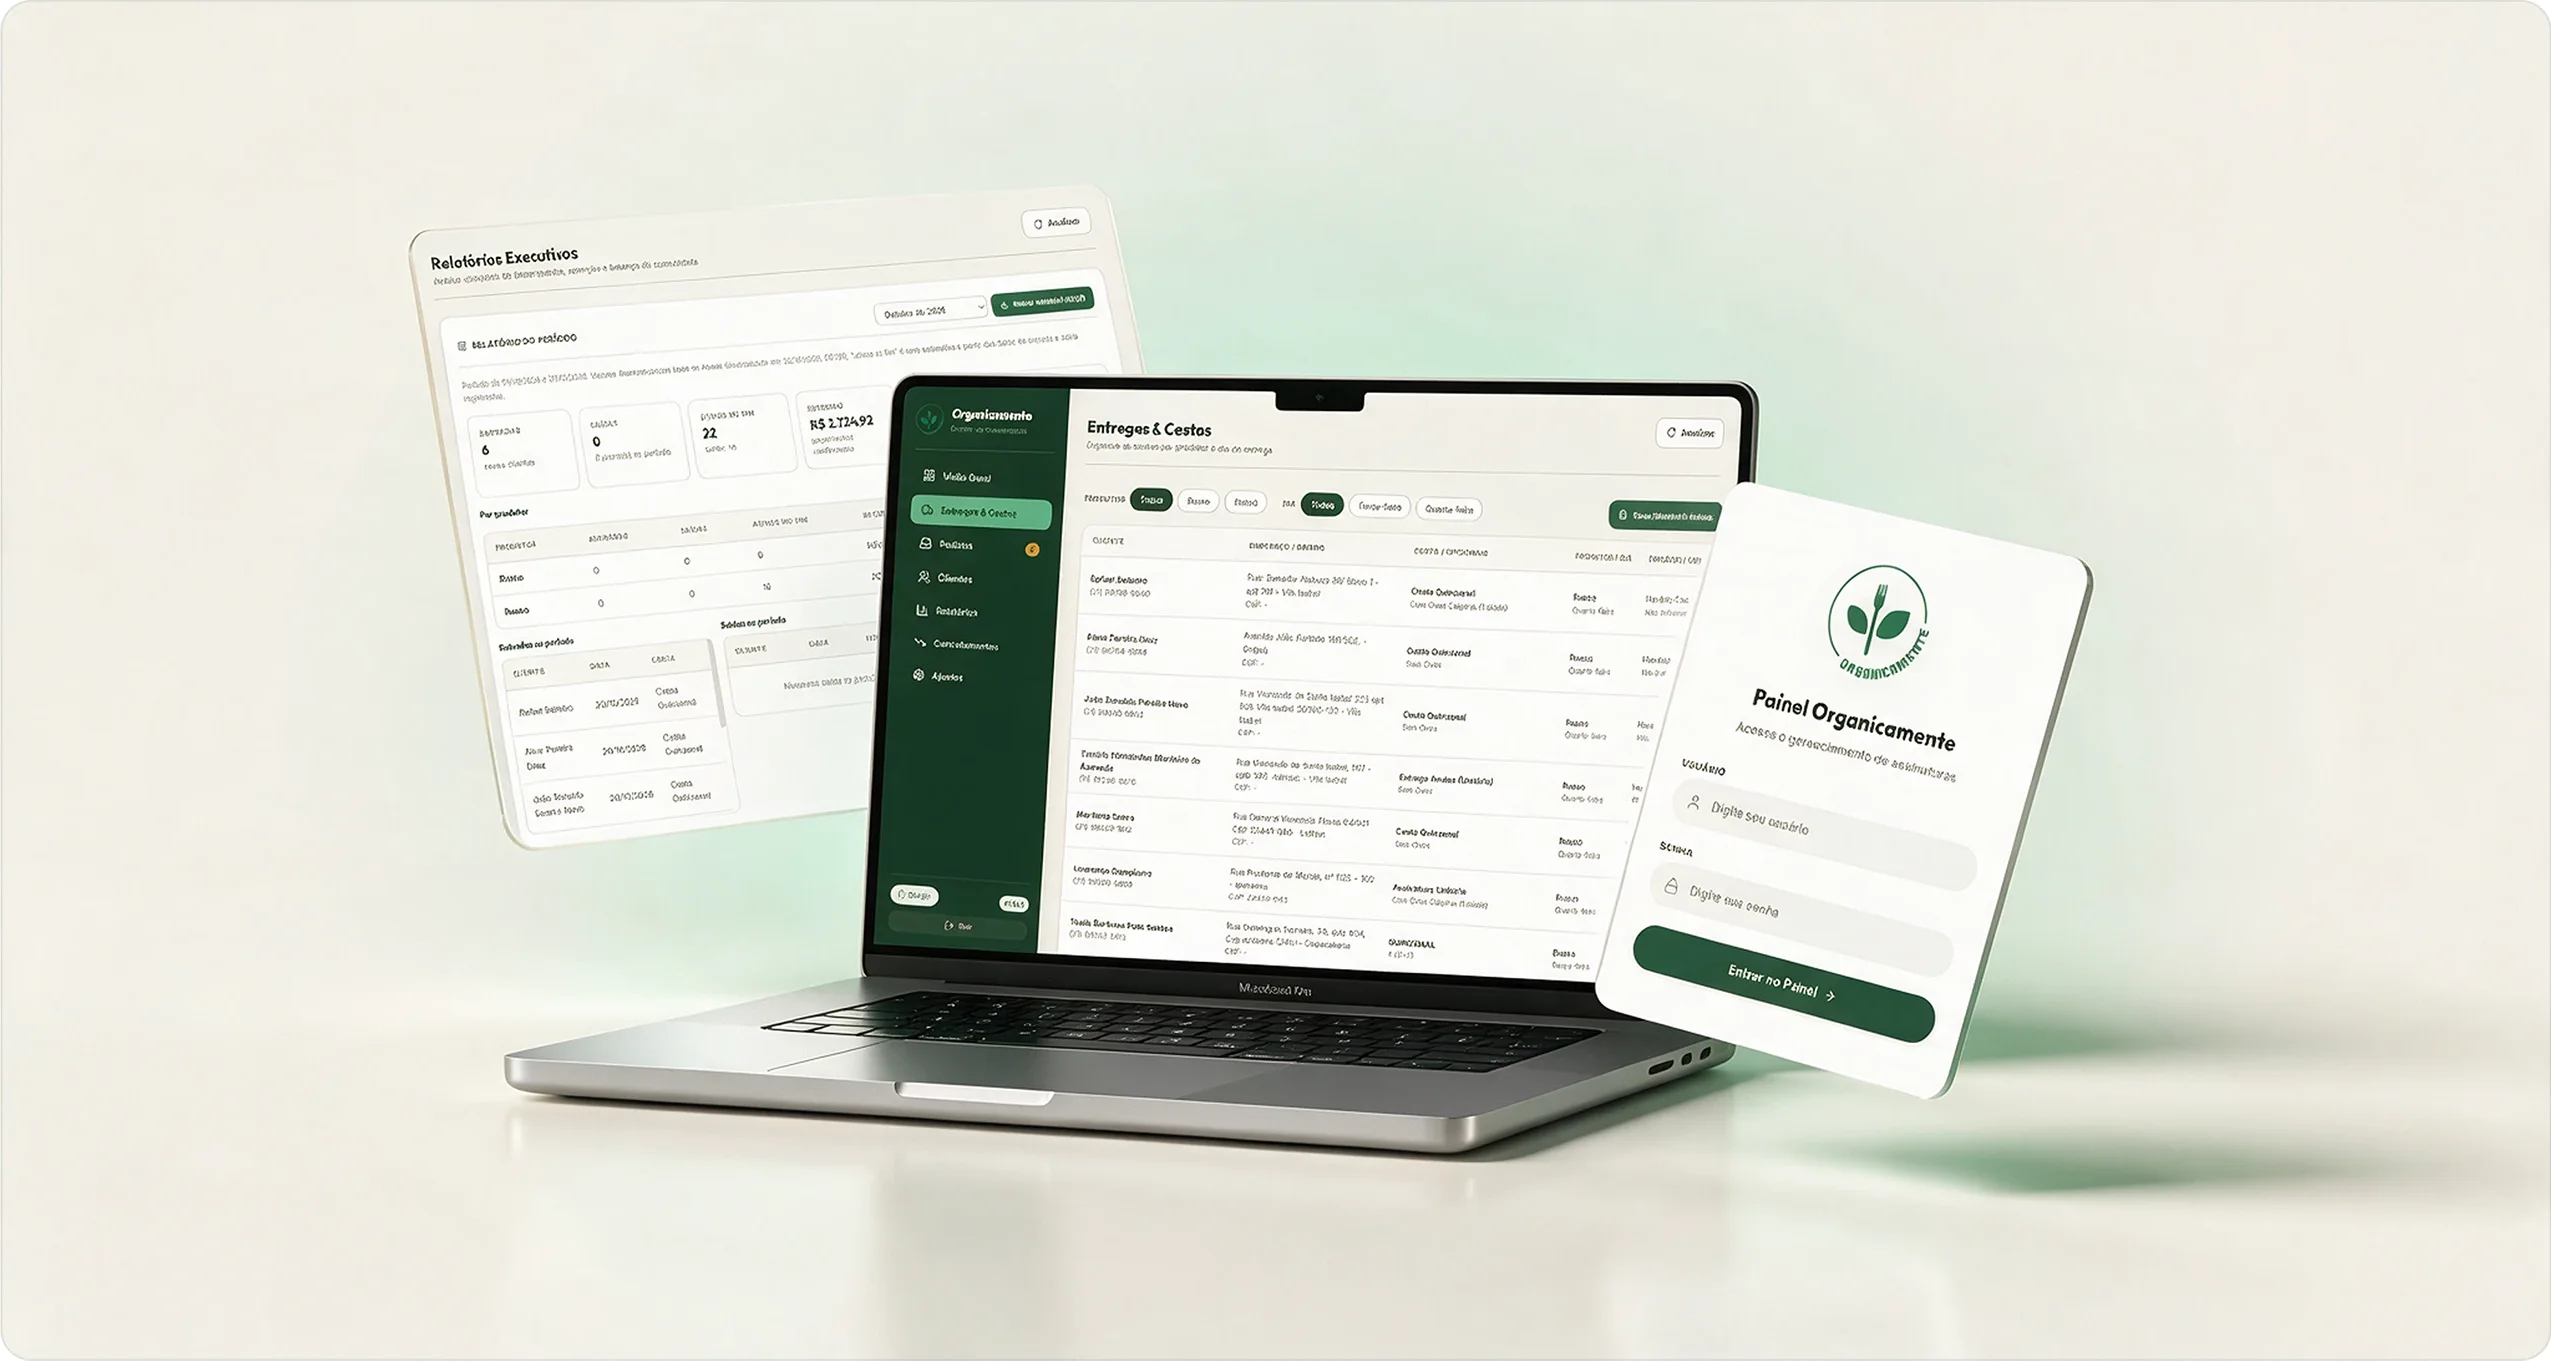
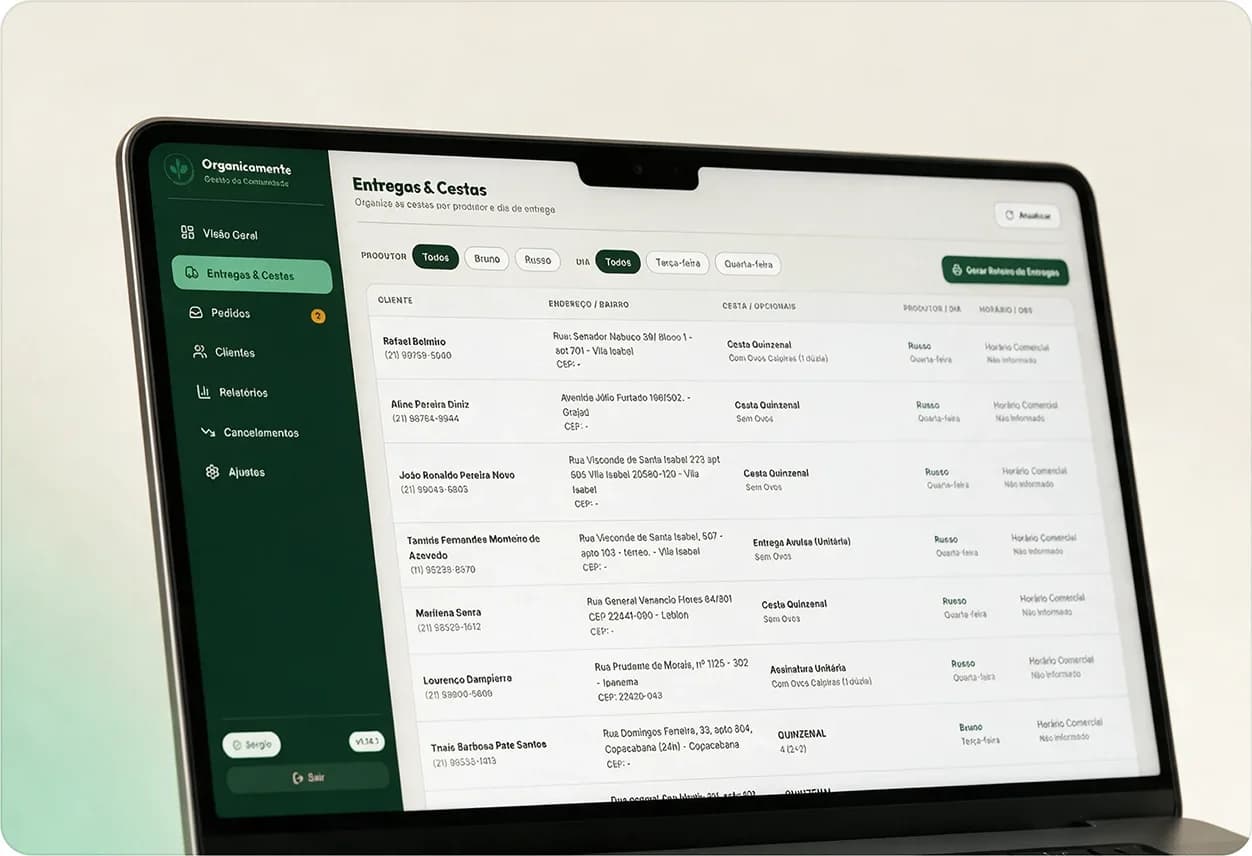
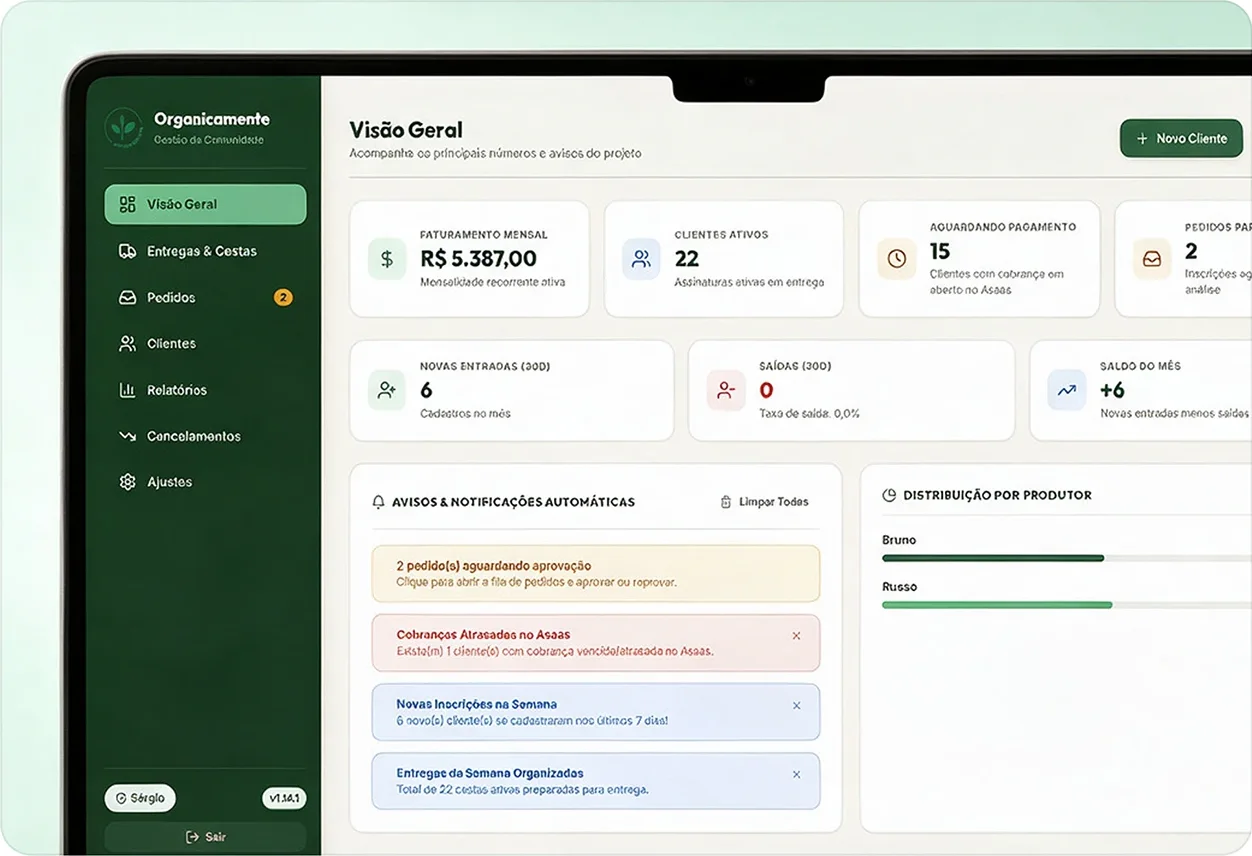
Admin dashboard
Built so the team knows who joined, how much to charge, where to deliver and who is overdue, without rebuilding that every week.
Overview
Recurring revenue, active customers, open charges, a queue of orders to approve and automatic alerts, such as overdue charges.
Deliveries
Organizes baskets by farmer and weekday and generates the delivery route.
Subscriber profile
Subscription and financial status, logistics, payment history and timeline, with a shortcut to WhatsApp.
Reports
Finance gets reports without recalculating every sign-up.
(11)
Dashboard design system
The dashboard grew in phases and accumulated parallel visual styles and 161 styles written directly in the HTML. To keep evolving it alone, without rework, I created a single base of tokens and components, which now lives in code and in Figma with the same names.
- Variables
- 68
- Styles
- 20
- Components
- 23
- Icons
- 21
39 colors, 11 spacings, 5 radii and 13 typography
15 text and 5 shadow and focus
with state variants
Lucide, as components
primary #1C4533
primary-light #2B684F
secondary #51B888
accent #EBF5EF
bg #F7F6F2
text #2D322E
success #2B684F
warning #945610
danger #B42322
info #215D9F
Outfit
- Titles
Inter
- Text
- 01
Contrast within AA
The gray of subtle text was darkened to 4.8:1 on white, and the green of the active navigation item got its own shade to reach 5:1.
- 02
Designed for mobile
Below 768 px, tables become cards. Below 576 px, modals open as panels that slide up from the bottom.
- 03
Figma and code with the same names
Each Figma variable points to the CSS token, such as var(--color-primary), so design and code do not drift apart.
The sign-up flow still uses the public page's styles, with its own tokens. Unifying the two systems is one of the next steps.
(12)
Results
The project is recent and data collection is still ongoing, but some results are already showing.
New subscribers per month
+140%
6 in the first month live, versus an average of 2.5 per month before
Before it was 5 subscriptions in two reference months
Closing time
-70%
in the time to close a subscription, from 2 to 3 business days to 12h to 24h
Calculated by the midpoint, from 60h to 18h
| Metric | Before (Forms) | Now | Change | Status |
|---|---|---|---|---|
| Lead-to-subscriber conversion | 5 subscriptions in two months (108 leads) | 6 new subscribers in the first month (previous average of 2.5 per month) | +140% | First data |
| Completion per flow step | Could not be measured in Forms | Measurement implemented | Collecting data | Collecting |
| Repeated questions to support | Frequent, about what was already written | Less frequent | To measure | Improved |
| Time to close a subscription | 2 to 3 business days | 12h to 24h | -70% | Improved |
| Finance work per sign-up | Manual calculation and checking | Automated and simplified | To measure | Automated |
The team has validated the dashboard and is transitioning from the old model to the new one, with official training planned. With more months of data, per-step conversion will show where the flow still loses people and guide the second iteration.
(13)
Learnings
I could not interview subscribers or leads who dropped off, so I do not know for sure whether the form was the main bottleneck, and the flow was validated only with the internal team. If I were starting over, I would hold five short conversations before designing and test the flow with outsiders.
So the next steps are to interview recent subscribers and leads who did not close, measure the funnel per step and use that data in the second iteration. It already plans to remove the sign-up fee and include partner products such as eggs, honey and dairy in step two.
Next case
Repositioning gummy supplements as a premium longevity category